Newsletters
 |
Sawmill Newsletter February 15, 2008 |
Welcome to the Sawmill Newsletter!
You’re receiving this newsletter because during the downloading or purchase of Sawmill, you checked the box to join our mailing list. If you wish to be removed from this list, please send an email, with the subject line of “UNSUBSCRIBE” to newsletter@sawmill.net .
News
Sawmill 7.2.12 is expected to ship today, February 15, 2008, or early in the coming week (we are working on some final issues, which may delay shipment until next week). This is a minor "bug fix" release, and it is free to existing Sawmill 7 users. It is not a critical update, but it does fix a number of bugs, adds support for many new log formats, and adds a few small features. It is recommended for anyone who is experiencing problems with Sawmill 7.2.11 or earlier. You can download it from http://sawmill.net/download.html . If it still shows 7.2.11 as the latest download, wait a few days and come back; 7.2.12 should be there by then.
Sawmill 7.2.11 had a performance issue which caused table reports to generate slowly when the "show parenthesized items" option was turned on, when using the internal database. This affected most reports generated by 7.2.11, in profiles using the internal database, and the effect was particularly pronounced for large databases. If you're using 7.2.11, and seeing slow performance while generating table reports, consider an upgrade to 7.2.12.
Sawmill 7.2.11 had a bug in the Flash Media Server plug-in which caused incorrect results in bandwidth columns. If you're analyzing Flash Media Server, with a profile created by 7.2.11, you should upgrade to 7.2.12, and recreate the profile, to get correct results.
This issue of the Sawmill Newsletter describes how use the "zoom" feature in reports to dig into the details of a dataset.
Get the Most out of Sawmill with Professional Services
Looking to get more out of your statistics from Sawmill? Running short on time, but need the information now to make critical business decisions? Our Professional Service Experts are available for just this situation and many others. We will assist in the initial installation of Sawmill using best practices; work with you to integrate and configure Sawmill to generate reports in the shortest possible time. We will tailor Sawmill to your environment, create a customized solution, be sensitive to your requirements and stay focused on what your business needs are. We will show you areas of Sawmill you may not even be aware of, demonstrating these methods will provide you with many streamlined methods to get you the information more quickly. Often you'll find that Sawmill's deep analysis can even provide you with information you've been after but never knew how to reach, or possibly never realized was readily available in reports. Sawmill is an extremely powerful tool for your business, and most users only exercise a fraction of this power. That's where our experts really can make the difference. Our Sawmill experts have many years of experience with Sawmill and with a large cross section of devices and business sectors. Our promise is to very quickly come up with a cost effective solution that fits your business, and greatly expand your ROI with only a few hours of fee based Sawmill Professional Services. For more information, a quote, or to speak directly with a Professional services expert contact consulting@flowerfire.com.
Tips & Techniques: Using Zoom To Get More Detail
When you first view reports in Sawmill, you will see the Reports Menu along the left of the page, with a list of a few dozen available reports. These are unzoomed reports, showing the "top ten" of each field in the database. For instance, in a media server analysis, you might see the top IP addresses in one report, with bandwidth and viewing time for each, or you might see the top publishing points, with bandwidth and viewing time for each. These are valuable reports, and a good starting point for any investigation, but Sawmill can give a lot more detail than you see in those reports. Because the power and flexibility of "zoom" is not always obvious, this newsletter is dedicated to describing how "zoom" works, and to exploring some of the more advanced zoom options.
For this example, we will use a web server dataset from 1998, for a web site which publishes reviews of novels. Clicking Pages/directories, we see the top-level directories and pages of the site:
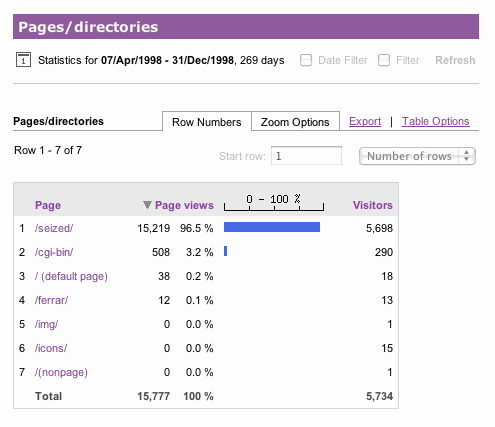
The Pages/directories Report
The top one, /seized/, is the main directory of the site, we we click on this. Clicking on it zooms, which means it applies a filter to the dataset, and possibly switches to a different report (we'll discuss this report switch more below). In this case, it filters the data to show only hits on the /seized/ directory, or files in it. When zooming on a hierarchical field like the "page" field, the default behavior is to stay in the same report, so Sawmill zooms to /seized/, and redisplays the Pages/directories report with this zoom filter, shown in yellow. The result of this is that it feels a lot like zooming into the folder structure on a hard drive--you click the folder name to see what's in it, and here we've clicked the directory name to see the contents:
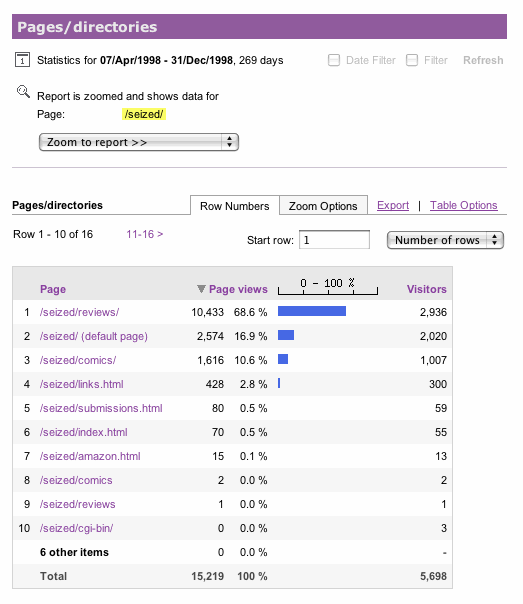
The Pages/directories Report, Zoomed On "/seized/"
In this web site, the reviews themselves are in the /seized/reviews/ directory, so we click that to zoom in another step, to see the contents of /seized/reviews/:
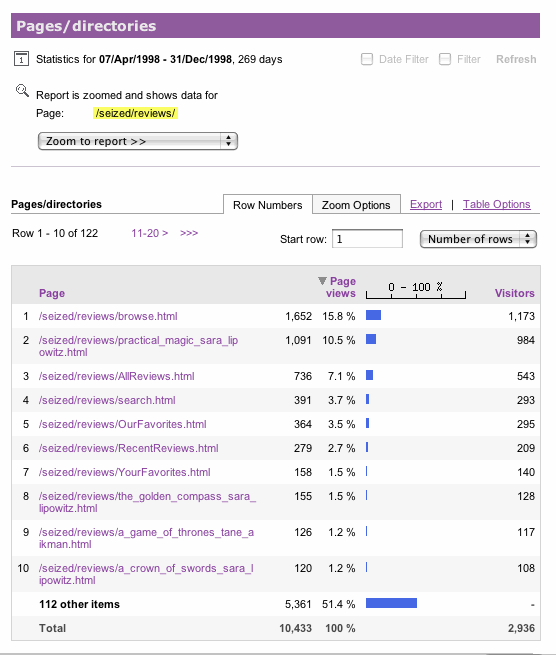
The Pages/directories Report, Zoomed On "/seized/reviews/"
There are 122 items in this table (only the top ten are shown), and if we looked further, we would see that most of them are review pages (the name of the novel, followed by the name of the reviewer). Rows 8, 9, and 10 here show the most popular reviews (ignoring Practical Magic for the moment), with 120, 126, and 155 page views, and if we looked further, we would see a smooth drop from that, toward the less popular reviews. But way out ahead of the pack is /seized/reviews/practical_magic_sara_lipowitz.html, the review of Practical Magic. This is an anomaly--this review has many times more page views than any other review. Why? Sawmill can help you find the answer. Let's start by zooming on that review, by clicking the second row. Since that's a filename, we can't zoom further in the Pages/directories report, so Sawmill automatically zooms to the Overview instead:
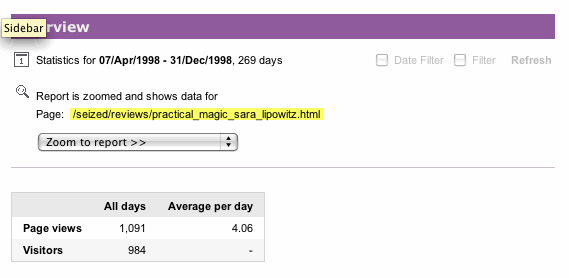
The Overview, Zoomed On "/seized/reviews/practical_magic_sara_lipowitz.html"
This isn't very interesting by itself (the data here is mostly the same as the row of the Pages/directories table), but it is a good staging point for further investigations. The key to further zooming is the "Zoom to report" menu, which appears below the yellow zoom description. We can select any report from that menu, and it will display that report, while preserving the zoom. This is different from what happens if we click the report in the Reports Menu, because that discards the zoom and goes back to the top-level report. By using the "Zoom to report" menu, we can break down the data on any field, finding out more about this particular subset of the data. Let's start by selecting Days from the "Zoom to report" menu. This shows the Days report, subject to the current filter:
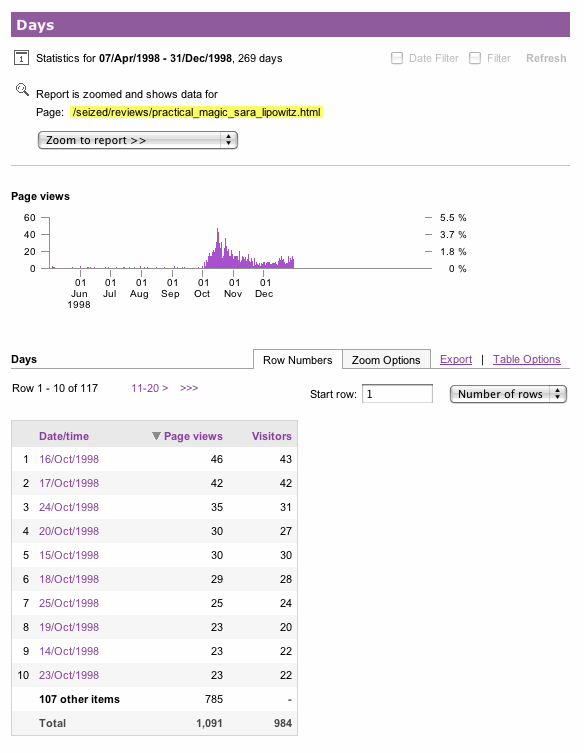
The Days Report, For Practical Magic
This report shows traffic on just that one file, day-by-day. The graph at the top shows that there was a large spike of traffic in mid-October, 1998. Before that, traffic on this novel review was very light; after that, it was much higher. So what happened in mid-October 1998? A little web research shows that was the release date (October 16, 1998) of the movie version of the novel Practical Magic. With the movie's release, the novel got much higher exposure than before, which sparked a sharp interest in the review. If the goal of this web site is the bring the maximum number of page views, then, this gives a clear recommendation for which novels to review: review those which are being made into movies. Sawmill's detailed analysis can give similar information for any web site, information which can be used to make the site more effective, or more popular.
Just for the sake of demonstration, let's do a little more digging. From "Zoom to report", select the "Domain descriptions" report. This shows the domain descriptions where traffic came from, to the review (again, we're still zoomed in on just this one review page, so we're seeing a very specific report: domain descriptions for the hits on Practical Magic):
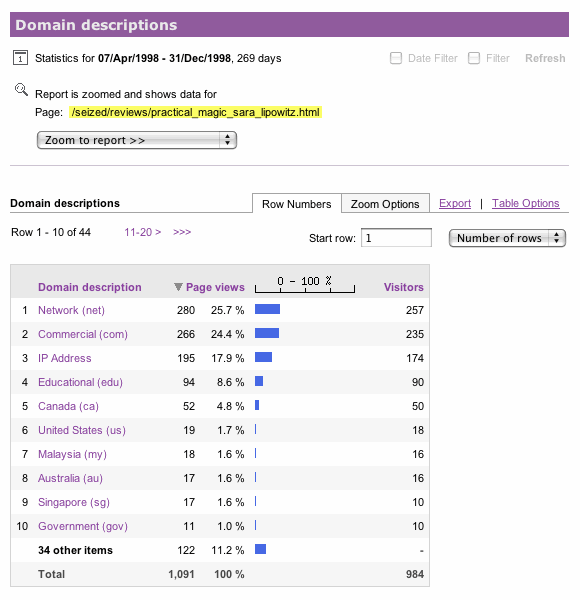
Domain Descriptions For Practical Magic
Much of the traffic was from .net, .com, .edu addresses, and IP addresses. But somewhat surprisingly, there are some hits from Singapore (*.sg hostnames). Let's look deeper, by clicking "Singapore (sg)", and zoom to the Hostnames report:
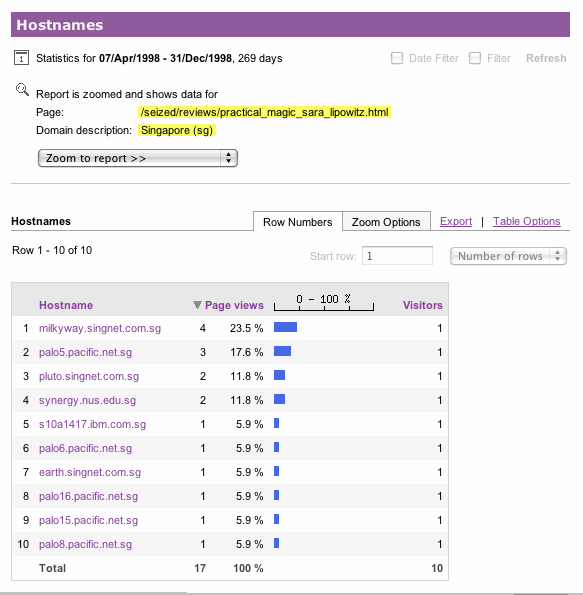
Hostnames from Singapore, For Practical Magic
This shows a list of all hostnames of the browsers who accessed this page from Singapore. Now, let's zoom on milkyway.singnet.com.sg, to see the specific events from that hostname. But this time, we'll save some time by clicking the Zoom Options tab, and selecting "Log detail" below it (this is usually faster because it takes several seconds to generate the Overview, but no time at all to display Zoom Options):
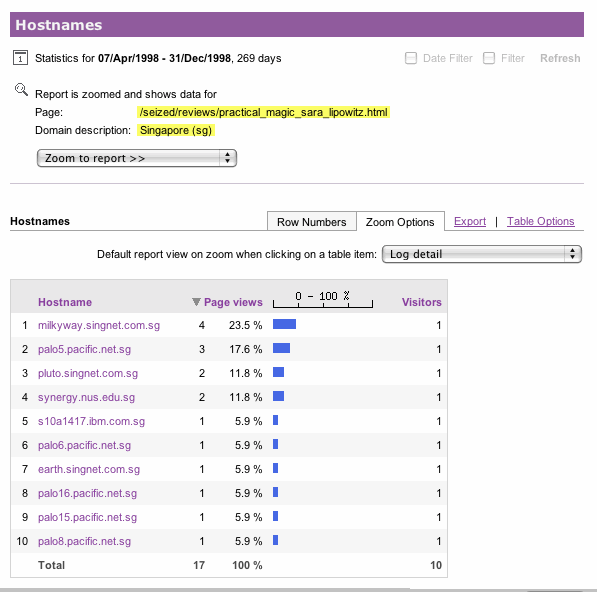
Hostnames from Singapore, For Practical Magic, With Log Detail Zoom
That indicates that we don't want to zoom to the Overview (the default), and then zoom from there to "Log details"--instead, we want to zoom directly to "Log detail." So now when we click milkyway.singnet.com.sg, we go straight to the "Log detail" report, and see full details of those four page views from milkyway.singnet.com.sg, on /seized/reviews/practical_magic_sara_lipowitz.html, including the exact time of each hit, the referrer, and more (additional fields have been truncated to fit here, but all database fields are in this report):
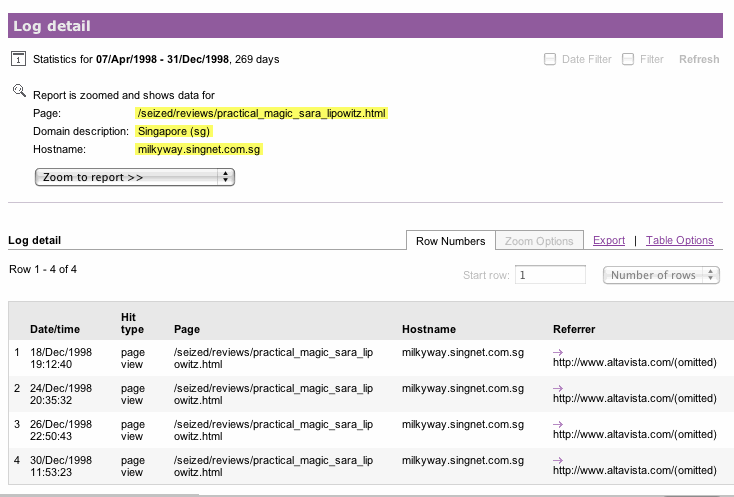
Log Detail For Practical Magic, from milkyway.singnet.com.sg
This type of deep forensic analysis is useful for any type of log data. Any number of zooms can be applied simultaneously, and can be used in conjunction with other types of filters, including date range filters and global filters. Zooming can continue on any number of fields, to any level, including the level of the events themselves, in "Log detail."
Advanced Topic: Changing The Default Zoom For A Report
In the example above, we zoomed by clicking on an item to zoom to Overview, and then selecting a report to zoom to. Later, we saved some time by using the Zoom Options tab in the report. But if we know we'll usually be zooming from Report A to Report B, we can modify Report A so its default zoom is to Report B, rather than to the Overview. This effectively changes the Zoom Options menu selection, so we don't have to do it manually if we just want to zoom to Report B. For instance, we could change the zoom default on the "Domain descriptions" report to zoom to the "Hostnames" report, so any time we click a domain, we'll see a list of hostnames under that domain. This is done by going to the Config page for the profile, then going to Manage Reports, then Reports/Reports Menu, then clicking the report name, clicking the Report Elements tab, clicking Edit to edit the report element, and choosing the destination report from the Default report on zoom menu. So after changing the default report on zoom to Hostname in the "Domain descriptions" report, the report element editor page would look like this:
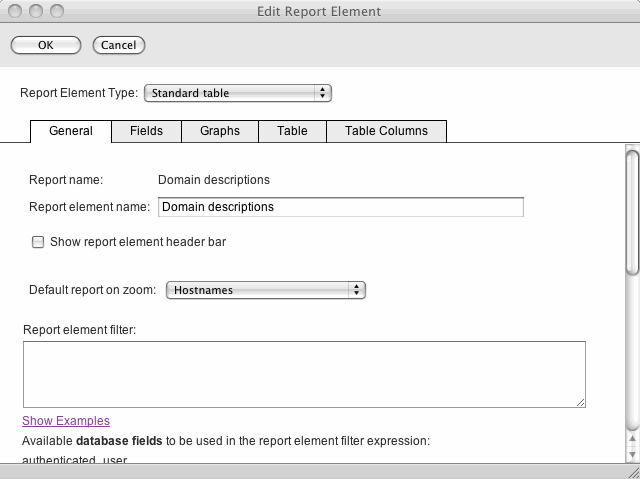
Changing Default Report On Zoom To "Hostnames"
Save the change, and in the future, any click in the "Domain descriptions" report will zoom to the "Hostnames" report.
Questions or suggestions? Contact support@sawmill.net. If would you like a Sawmill Professional Services expert to implement a customization, contact consulting@sawmill.net.
[Article revision v1.1]
[ClientID: ]