Newsletters
 |
Sawmill Newsletter April 15, 2008 |
Welcome to the Sawmill Newsletter!
You’re receiving this newsletter because during the downloading or purchase of Sawmill, you checked the box to join our mailing list. If you wish to be removed from this list, please send an email, with the subject line of “UNSUBSCRIBE” to newsletter@sawmill.net .
News
Sawmill 7.2.14 shipped on March 26, 2008. This is a minor "bug fix" release, and it is free to existing Sawmill 7 users. It is not a critical update, but it does fix a number of bugs, adds support for several new log formats, and adds a few small features (mostly notably, a new "Save To Menu" button in the reports, and the "Use Overview for totals" option discussed below). It is recommended for anyone who is experiencing problems or slow reports with Sawmill 7.2.13 or earlier. You can download it from http://sawmill.net/download.html .
This issue of the Sawmill Newsletter describes the new "Use Overview for totals" option, showing its affects on reports, and discussing the performance ramifications.
Get the Most out of Sawmill with Professional Services
Looking to get more out of your statistics from Sawmill? Running short on time, but need the information now to make critical business decisions? Our Professional Service Experts are available for just this situation and many others. We will assist in the initial installation of Sawmill using best practices; work with you to integrate and configure Sawmill to generate reports in the shortest possible time. We will tailor Sawmill to your environment, create a customized solution, be sensitive to your requirements and stay focused on what your business needs are. We will show you areas of Sawmill you may not even be aware of, demonstrating these methods will provide you with many streamlined methods to get you the information more quickly. Often you'll find that Sawmill's deep analysis can even provide you with information you've been after but never knew how to reach, or possibly never realized was readily available in reports. Sawmill is an extremely powerful tool for your business, and most users only exercise a fraction of this power. That's where our experts really can make the difference. Our Sawmill experts have many years of experience with Sawmill and with a large cross section of devices and business sectors. Our promise is to very quickly come up with a cost effective solution that fits your business, and greatly expand your ROI with only a few hours of fee based Sawmill Professional Services. For more information, a quote, or to speak directly with a Professional services expert contact consulting@flowerfire.com.
Tips & Techniques: Showing Correct Totals and Percents for Unique Values
Important Note: The feature described in this article has been
disabled by default in Sawmill 7.2.14 for performance reasons. It can
be very useful, but it also causes the display of reports to be
somewhat slower than when it is turned off. With some types of log
data, and with some configuration options, the display of reports can
be painfully slow. So, it is recommended that you use this option only
when it is really needed.
Calculated report columns were introduced in Sawmill 7.2.6 and
described in the Sawmill
Newsletter for April 2007. This article uses the same example.
Please refer to that
newsletter for a more complete explanation of the example and
calculated report columns and how to set them up. This article will use
the same example and explain the differences in the set up that allow
totals for calculated report columns to show in the Total row.
Suppose you have a report like this one:
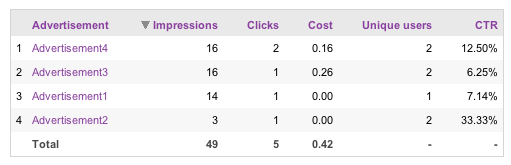
The calculated column is CTR, which stands for "Click Through Rate."
The dashes in the Total row indicates that these totals are not
available. To see them, you must turn on the report display option "Use
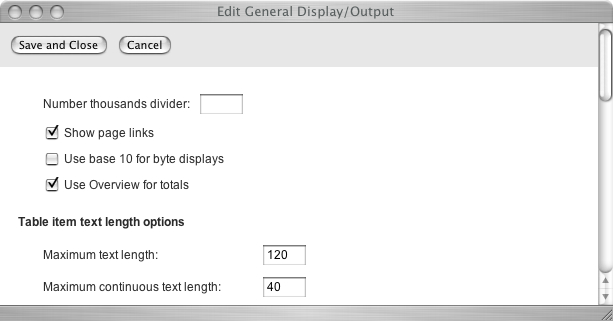
Overview for totals." To do this, go to Config -> Manage Reports
-> General Display/Output -> Edit General Display/Output for
the profile, check "Use Overview for totals" and click "Save and Close."
You can also add it in the .cfg file for the profile by searching first
for "statistics = {", then "miscellaneous = {" to
find the statistics miscellaneous group and adding use_overview_for_totals
= "true" anywhere in that group (or changing the value from false
to true, if it is already there).
The reason the feature is called "User Overview for totals" is that the
values in the Total row (which are also used as the denominators for
percents) come from the Overview report, with all active filters
applied.
With "User Overview for totals" turned on, the report will look like
this:
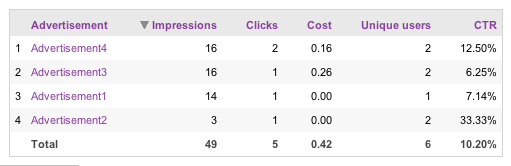
The total in the Unique Users column is the actual total of users
associated with advertisements, not the sum of the columns. This will
be explained more fully in the next section.
The total in the CTR column does not add up to the total of the
percents in the rows because it is calculated from values in the Total
row. Note: It also doesn't add up to 100% as percent columns usually do
because it isn't a percent column as far as Sawmill is concerned, but a
calculated column formatted as a percent. Regular percent columns add
up to 100% because the denominator used for the percent is the sum of
the values in the associated numeric column.
In addition to turning on "Use Overview for totals," one change needs
to be made to the way the calculated column is set up in the .cfg file
for the profile. The April 2007 Newsletter said to add this field to
the end of the database fields section of the profile:
ctr = { label = "CTR" log_field = "ctr" type = "string" display_format_type = "string" expression = `((1.0 * cell_by_name(row_number, 'Clicks')) / cell_by_name(row_number, 'Impressions')) * 100.0` } # ctr |
In order for this calculated column to work correctly in Sawmill 7.2.14, whether "User Overview for totals" is on or off, the field must look like this. The type and display_format_type must be float. The cell names must match the database field names, which means they must be lowercase. The file that is edited is the .cfg file for the profile, which is in LogAnalysisInfo/profiles.
ctr = { label = "CTR" log_field = "ctr" type = "float" display_format_type = "float" expression = "((1.0 * cell_by_name(row_number, 'clicks')) / cell_by_name(row_number, 'impressions')) * 100.0" } # ctr |
The column that is added to the advertisement report is the same.
ctr = { data_type = "unique" display_format_type = "%0.2f%%" field_name = "ctr" header_label = "CTR" show_bar_column = "false" show_graph = "true" show_number_column = "true" show_percent_column = "false" type = "number" visible = "true" } # ctr |
This is where the display_format_type must be specified. The only restriction is that it must be a numeric type. Examples of other possible values for display_format_type for other calculations might be %0d%%, %0.4f, %0.6f%%, bandwidth, duration_compact, duration_microseconds, duration_milliseconds, float and integer. The named types are explained in the Custom Formats section of the Technical Manual.
When "User Overview for totals" is turned on, the data_type can be unique
or float. When it is turned off, if it is float,
the calculated column will simply be summed, like this:
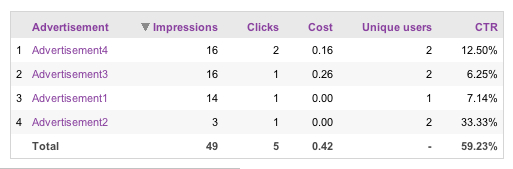
This probably is not appropriate for many calculated columns. Setting
the data_type to unique simply tricks Sawmill into
replacing the total with a dash, as it does with actual columns of unique
values, which gives you the table in the first example screenshot.
Showing Correct Totals and Percents for Unique Values
If you have a report with a percent column associated with a numeric
column of type unique, the only way to see meaningful percents is to
turn on "User Overview for totals." Turning it on also causes the
correct total to be shown in the Total row. Consider this example:
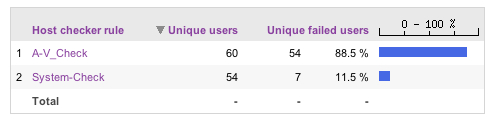
If you have been using Sawmill before version 7.2.9, you are used
to seeing a dash in the Total row for columns with unique values. The
unique data type means that if the same value occurs more than once,
such as the same IP address or user ID, the value is only counted once.
Dashes were displayed because the only option available for the Total
row was to show the sums of the columns, which is meaningless because
there may be overlap between the unique values represented by the
count, that is, the same user ID might be counted in more than one row.
In this example there are percent columns associated with the unique
values, and the percents are based on the sum of the values in the
corresponding column rather than on the total number of unique users
subjected to each rule, which is misleading. How misleading this is
depends on
the amount of overlap between the groups of users. The percent was not
suppressed with a dash because percent columns are rarely used with a
column of type unique.
When "User Overview for totals" is turned on, the report looks like
this:
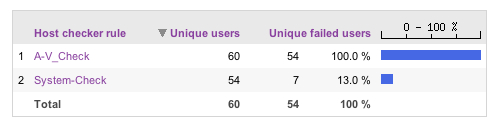
Note that though the percents in the columns don't add up to 100%,
the totals are 100%. That's because 100% of the users in the "Failed
unique users" column failed a rule.
Here is a look at the same log data presented in a different way:
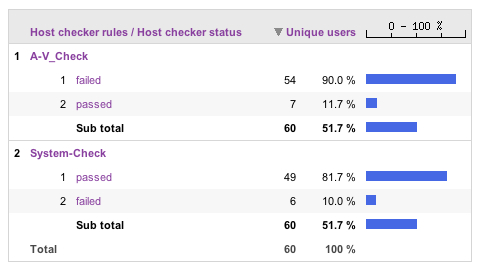
Here the columns in the subtotal are associated with Unique Users
instead of with Unique Failed Users, so the percents are based on the
total number of unique users. But the percents and the Subtotals are
based on the total in the Total row, that is, all unique users, not the
subset of unique users subjected to the particular rule. A future
version of Sawmill may make the denominator of the percents in the
percent column configurable, with the Total and the Subtotal as two of
the options. Until then, it would be a good option to suppress the
Subtotal row if "User Overview for totals" is used with a report like
this one.
With "User Overview for totals" turned off, this is what the same
report looks like:
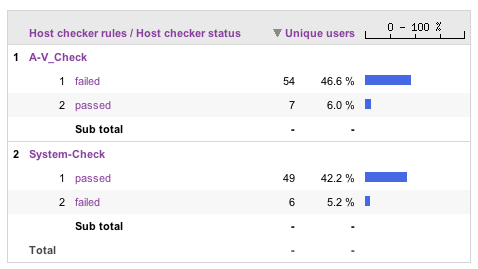
Again, note that the percentages are based on the sums of the values
in the Unique Users column, in this case the subtotals.
Working Around Performance Problems
The main reason the report display is slow when adding these values
to
the Total row is the special internal filter which eliminates rows with
parenthesized values, which has to be applied again when the filtered
overview is retrieved. Empty database fields are set to the special
value "(empty)," and many other parenthesized values appear in reports,
including the "(no search engine)" value in the Search Engines reports,
and similar values in other reports. These parenthesized items are
removed by default, to improve report legibility, and to make
percentages and pie charts more meaningful. When "show parenthesized
items" is turned on, empty fields will show up in reports like this:
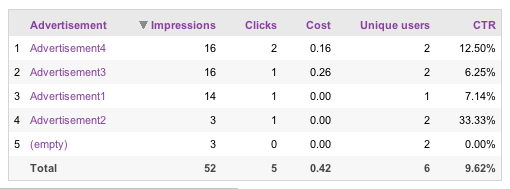
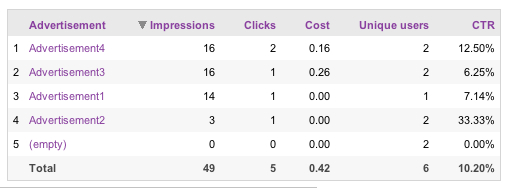
You can see in this example that the numeric field Impressions has a
value for Advertisement "(empty)" and it changes the total for CTR from
10.20% to 9.62%. In some reports it may not be possible to overcome
this distortion, but in this example, it is possible to change the
filter that counts impressions. Suppose for the report above,
impressions are counted with a log filter like this:
filters = { count_impressions = { value = "impressions = 1;" label = "Count Impressions" comment = "" } # count_impressions } # filters |
This filter assumes that every event in the log represents an advertising impression. You can change the filter to take into account the value of the advertisement field and the clicks field, like this:
filters = { count_impressions = { value = "if (advertisement ne '(empty)' or clicks > 0) then impressions = 1;" label = "Count Impressions" comment = "It's only an impression if there was an advertisement or a click." } # count_impressions } # filters |
This results in a report where the row "(empty)" is still there, but it doesn't distort the total because both impressions and clicks are zero.
Because this is done in a log filter, the value of impressions will
have already been set to "(empty)" and the fields are accessible
directly by name. In a parsing filter, the syntax may be more
complicated. Again, such a manipulation may not make sense in all
contexts and you may have to choose between performance and not having
to worry about the effects of including "(empty)" in the report.
To turn on "Show parenthesized items" for any report through the
Sawmill interface, follow these steps:
- Go to Config -> Manage Reports -> Reports/Reports Menu.
- Click on the name of the report you want to change.
- Click the Report Elements tab.
- Click Edit for the report element you need to change (usually there is only one report element).
- Click the Table tab.
- Check the checkbox for "Show parenthesized items."
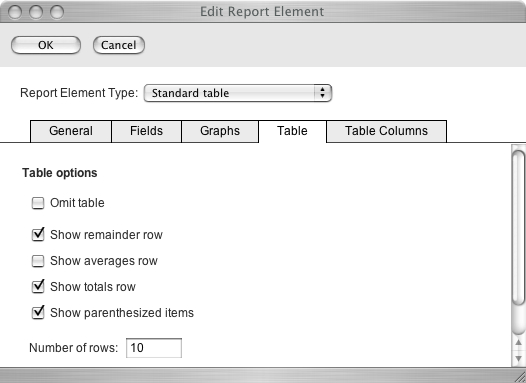
You can also make this change by editing the .cfg file for the profile. Within the report_element for the report you want to change, find omit_parenthesized_items and change the value to false.
[Article revision v1.0]
[ClientID: ]