Customize Report Element
Using the Customize Report Element
The Customize Report Element button is available for most report elements to customize the graphs and/or the table of a report element while viewing reports.
What is the difference between Customize Report Element within a Report and the Reports Editor in Config?
In summary:
You can find the Customize Report Element function, by selecting a report and on the far right of the report you will see "Export Table" and "Customize". Once you select "Customize", then this dialogue box will open:
Customize Report Element Tabs
Graphs
Sort by, determines how to sort the graphs.
Show legend,check to show the graphs legend. If sort by is equal "All descending" or if no table is shown then you should always check this option. Chronological graphs have no legend because date/time values are Fields list with checkboxes.
Check the fields for which a graph should be shown or click Select/Deselect All.
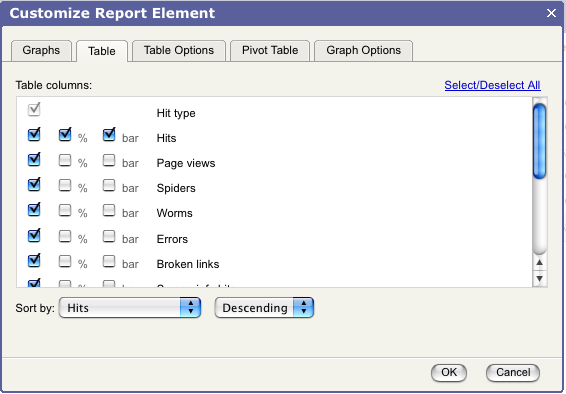
Table
It contains sort by, sort direction and the table columns in the fields list.
There is only one checkbox for non-aggregating fields (text column) and three checkboxes per aggregation field which can be read as "show numerical column", "show percent column" and "show table bar graph column".
Table Options
Set the number of rows, and the default setting means the number of rows after a login, or if a filter is applied.
Pivot Table
Select the box for showing the table it the number of rows and how the fields will be sorted
Graph Options
Select bar, line or pie chart, with the number or rows and variables, including the screen size of the graph.