SAWMILL FEATURES
Sawmill is universal log analysis software that runs on every major platform. It can process almost any type of log data. The reports that Sawmill generates are hierarchical, attractive, and heavily cross-linked for easy navigation. Complete documentation is built directly into the program.
Here are just a few of the major features of Sawmill:
- Easy To Use
- Extensive Documentation
- Live Reports & Graphs
- Package of Powerful Analysis Tools
- Attractive Statistics
- Database Driven
- Very Fast
- Easy To Install
- Highly Configurable
- Works With a Variety of Platforms
- Processes Almost Any Log File
Easy To Use
Sawmill presents an intuitive web-based user interface, which leads you through every step of browsing your log file's statistics. The New Profile Wizard asks questions when it needs information, so you only have to deal with the configuration options which are relevant to the task at hand.
 Statistics pages are full of links to related information, organized intuitively so you can get to the information you want with a minimal number of clicks. All aspects of Sawmill's profiles are customizable through the web interface, so you can create new profiles, custom reports, custom filters, and much more, directly from Sawmill's web interface.
Extensive Documentation
The manual for Sawmill is built right into the web interface program, so it's always at your fingertips as you use the program. Throughout the HTML interface, there are links to relevant sections of the online documentation, and wherever a configuration option is mentioned, or a value is requested for it, there is a link to that option's documentation page. You can browse the documentation by running any copy of Sawmill.
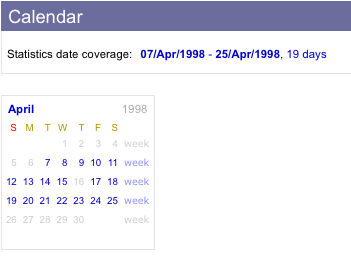
Live Reports & Graphs
Sawmill statistics are "live," for unparalleled flexibility while viewing the statistics. Sawmill shows you a collection of interlinked web pages which allow rapid navigation of the entire range of your log statistics.
 Convenient links and menus right on the statistics pages let you zoom in, set up real-time filters, show and hide columns of the tables and other view elements, sort the data however you want, and much more.
Powerful Dynamic Filters
Sawmill allows dynamic segmentation of reports through its advanced filtering capabilities. Simple one-click "zoom" filters provide easy zooming into any item appearing in an report. For more advanced dynamic filtering, Sawmill provides advanced Boolean (AND/OR/NOT) selection based on multiple criteria, including wildcards and regular expressions. Log data can also be filtered on import using Log Filters, which use Salang, Sawmill's build-in scripting language, for extremely flexible filtering and conversion.
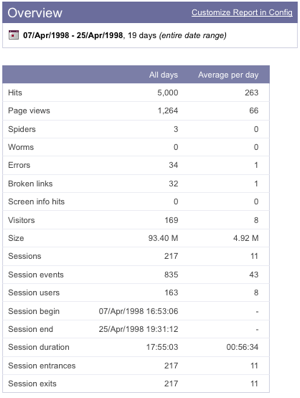
Attractive Statistics
Sawmill's statistics are attractive. The tables are colored for easy reading, and the graphs are designed to be easily readable. You'll be able to take the reports right out of Sawmill and show them to your boss, or your investors, or anyone else, without having to reformat them to make them look good - they already look good.
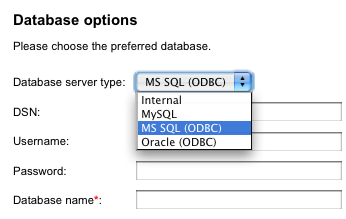
Database Driven
Sawmill stores your statistics in an optimized database. This can be Sawmill's own built-in high-performance database, or it can be a Microsoft SQL Server, Oracle, or MySQL database.
 This database can be incrementally updated as new log files arrive, and old data can be periodically expired from the database. Sawmill generates reports directly from the database, which is queried by clicking on reports associated with the database fields.
Role-based Authentication
Sawmill supports role-based authentication, allowing you to control in detail what your Sawmill users have permission to do. You can create roles with varying degrees of permissions (e.g., permissions only to view reports for specific profiles; or permissions to edit but not delete Log Filters), and assign each user to one or more roles.
True Real-time reporting
Sawmill can be configured to provide true real-time reporting--up-to-the-second reporting on the current contents of your log files. There is no need for explicit database refreshes, and no need to wait for the log data to finish loading into the database before viewing reports from the latest data.
Very Fast
Since Sawmill generates a new report every time you click the mouse, it has been heavily optimized for speed. Most pages load in less than five seconds, so you won't be waiting for your statistics. There is no limit to the amount of data Sawmill can analyze, and even really huge datasets (gigabytes of log data) can be browsed in real time. Sawmill uses multiple levels of caching to ensure that once something has been computed, it will re-use the computation when possible, for highest performance.
Easy To Install
Sawmill is extremely easy to install. For Windows or MacOS, just run the installer and launch the program. For UNIX, just tar/gunzip it and run the executable. Sawmill starts its built-in web server, and you're ready to start using it immediately. Or if you want to run it as a CGI program, you can drop the executable in the CGI directory of your web server, and start using it immediately from your favorite web browser.
Highly Configurable
Sawmill is highly configurable using a large set of configuration options. These options can be configured through the graphical user interface from any web browser. The options let you choose which reports are available (or you can create your own custom reports), what types of information are tracked, which log entries are filtered out, what the statistics look like, and much, much more.
Works With A Variety Of Platforms
Sawmill runs on all major platforms. There are currently pre-built versions for the following platforms:
- Window (x86 or x64)
- Linux (x86 or x64)
- Solaris (SPARC, x86, or x64)
- FreeBSD (x86)
- OpenBSD (x86)
Source code is also available (obfuscated), so Sawmill can be compiled and run on any system with a C++ compiler. If you are interested in seeing Sawmill on any other platforms, send mail to sawmill@flowerfire.com.
Processes Almost Any Log File
Sawmill can process the text log files generated by all popular devices and servers, in over 700 formats.
If you want to analyze a log in a different format, Sawmill also lets you specify a custom log format. If your log is generated by publicly-available software, we can do this for you--just email a sample of your log file to sawmill@flowerfire.com, and we can write you a log format file that you can plug right in to your copy of Sawmill.